A Profile of Canadian Women in Rural, Remote and Northern Communities
Demographic Profile
- In 2006, the last census year for which data are currently available, approximately 2.8 million women resided in rural Canada, while another 176,000 women resided in remote areas. This represents approximately 18% of the total female population in Canada, and approximately 50% of the total rural and remote population.
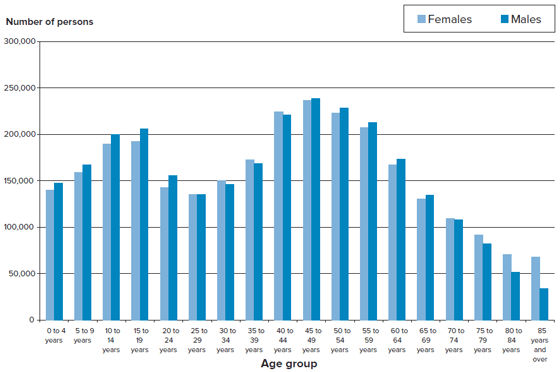
- Young men and boys outnumber young women and girls in rural, remote and urban areas between the ages of 0 and 24 years. In urban areas, this pattern is reversed, with women above 24 years outnumbering men. However, in rural areas, this is only true for women between the ages of 30 and 44, and those over 70. In remote areas, women are the majority only among those between the ages of 25 and 39 and 75 and older.
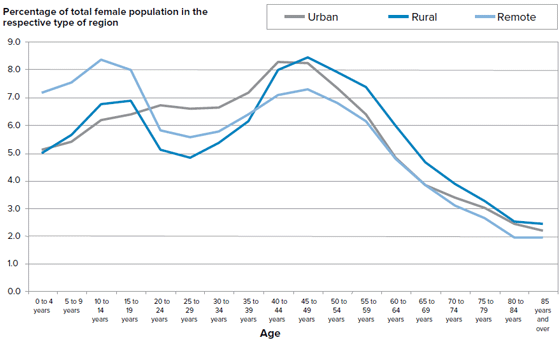
- Figure 1 presents the distribution of female population by age cohorts in urban, rural and remote areas in 2006. In remote areas, over 8% of the female population is between the ages of 10 and 14 (compared to 6.7% in rural areas and 6.2% in urban areas).
Figure 1 Female Population by Age Groups, Canada, 2006
Labour Force and Participation Rates
- There were approximately 1.3 million rural women in the labour force in 2006; in addition, there were almost 74,000 women in the labour force in remote areas. These women represented approximately 45.6% and 44.6% of rural and remote labour force, respectively. These percentages are lower than in urban areas, where women represented 47.8% of the labour force in 2006.
- Participation rates, employment rates and unemployment rates show both regional and gender divides, with some interesting difference across indicators:
- Men are more likely to have higher labour force participation and employment rates than women in all regions, whether urban, rural or remote. Rates of participation are highest for both genders in urban areas, start to decrease in rural areas, and are lowest in remote areas. Figure 2 illustrates this pattern for participation rates.
- In addition, participation rates of females residing in rural areas have remained below those in urban areas in recent years.
- The greatest gender gap is evident in rural areas, where the participation rate of women was 11.6% lower than the rate for men.
Figure 2 Labour Force Participation Rates (Population 15 Years and Over), Canada, 2006
Unemployment Rates
- For women and men, unemployment rates are highest in remote areas, start decreasing in rural areas, and are lowest in urban centres.
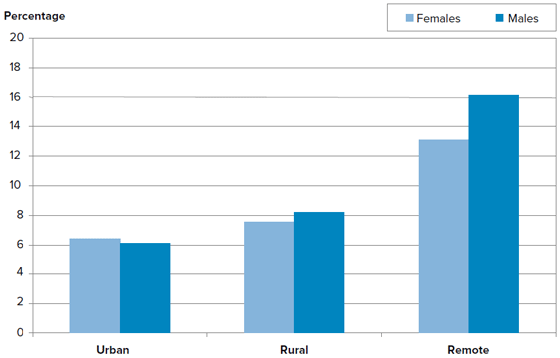
- There is a gender gap although it is not uniform across regions. As shown in figure 3, in urban areas, the female unemployment rate was 6.3%, compared to 6.1% for males. In contrast, in rural and remote areas, the male unemployment rate was higher than the corresponding female rates. The gender differential was particularly pronounced in remote areas, where the male unemployment rate was 16.1%, while the female unemployment rate was 13.1%.
Figure 3 Unemployment Rates (Population 15 Years and Over), Canada, 2006
Employment Rates
- Compared to urban women, a smaller share of rural women are employed; however, rural women have gained relative to urban women over the 1996 to 2010 period.
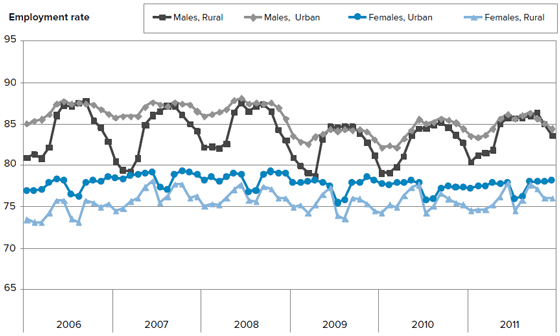
- Seasonality is greater for the rural workforce than the urban workforce, for each industrial sector except agriculture (Rothwell, 2002). Employment seasonality is more marked among men. Rural males show considerably more employment seasonality than urban males. The employment rate for males in the peak (summer) months is as high in rural areas as in urban areas. Thus, the lower average annual employment rate in rural areas is not due to a smaller share of males having a job during the year – rather it is due to a smaller number of males working the full year (Figure 4).
- Women in rural and urban areas show a similar swing in seasonality, but the pattern is different from their male counterparts. Female employment tends to dip in the summer months. In each case, the employment rate is 2 to 3 percentage points lower for females in July and August (Figure 4).
Figure 4 Employment Rates, Core-age Workforce (25 to 54 Years of Age), Canada, Monthly Data, 1996 to 2011
* The 2001 to 2005 data use the 2001 geographic delineation and geographic grid, and the data for 2006 to date use the 2006 delineation and geographic grid.
1. The employment rate is the percent of the population, 25 to 54 years of age, who are employed.
Employment by Industry Sector
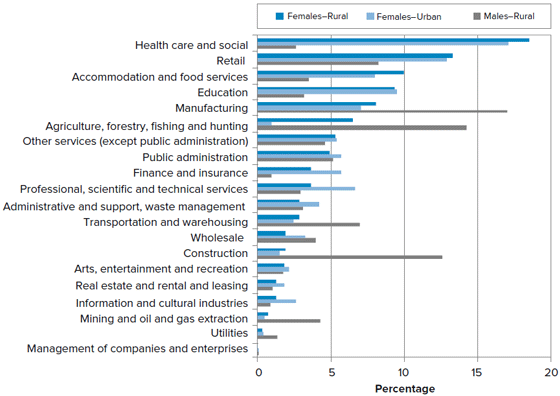
- Five industry sectors comprise close to 60% of female employment in rural areas; these industry sectors are: health care and social assistance (245,955 jobs), retail trade (176,530), accommodation and food services (132,720), educational services (123,875), and manufacturing (106,890).
- The main industry sectors for female employment in remote areas are: health care and social assistance, educational services, public administration, retail trade, and accommodation and food services. These five industry sectors comprise approximately 62% of female employment in remote areas.
- In terms of representation in non-traditional industries, there is still a clear gender and regional divide. For example, overall, women are under-represented in the areas of mining and oil and gas extraction compared to men, comprising 18.3% of those employed in this area. The representation of women living in rural and remote areas is even lower, at 12.6%.
- Similar trends are found in the agriculture, forestry, fishing and hunting industry, where overall, women account for 30% of the jobs in this sector, and for women living in rural and remote areas, it drops further to 27.3%.
Figure 5 Employment by Industry Sector, Canada, 2006
Source: Statistics Canada, Census of Population 2006.
Occupational Profile
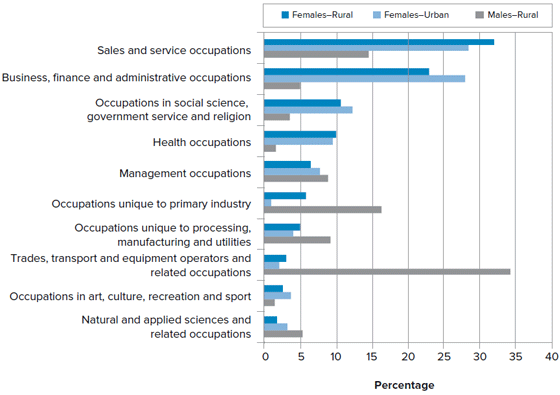
- Regardless of the region, women are concentrated in two main occupations: ‘business, finance and administrative occupations' and ‘sales and service occupations' (Figure 6). The first occupational group is particularly important for women in urban areas (28% of jobs held by women), while the second is prevalent among women in rural and remote areas (32% of jobs held by women).
- Among non-traditional occupations in rural and remote areas, women hold 21% of jobs in the natural and applied sciences and only 7% of jobs in the trades, transport and equipment operators sector.
Figure 6 Occupational Profile for Selected Population Groups, Canada, 2006
Source: Statistics Canada, Census of Population 2006.
Income Levels
- The average employment income for women is lower than that for men in all regions and census years (1996, 2001, 2006).
- In rural areas, the average employment income gap for younger women (15 to 29 years) is greater than in urban areas. Moreover, these gaps remained virtually stable between 1996 and 2006.
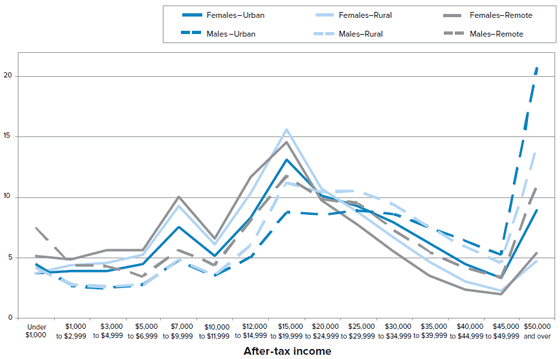
- Women are more likely to be living in lower income situations than men (that is, earning less than $25,000 per year, based on after-tax income).
- In contrast, there are more men than women in income classes above $25,000. Furthermore, the gap between the number of women and men in each income class widens as the income level increases.
Figure 7 Individual Reporting After-Tax Income in 2005, Population 15 Years and Over, Canada, 2006
Educational Attainments
- In 2006, close to 1.6 million rural women and 74,000 women in remote areas had earned a certificate, diploma or degree, compared to 1.5 million rural men and 71,000 men in remote areas.
- In rural and remote areas, women were slightly more likely than men to have attained a certificate, diploma or degree (CDD)1 in 2006, while there was virtually no difference between genders in urban areas. However, there were substantial regional differences, with fewer individuals attaining a CDD education as one moves from urban to rural to remote areas.
- In 2006, 56% of women residing in remote areas had a CDD education, compared to 51% of men in the same areas. Meanwhile, 69% and 78% of women in rural areas and urban areas, respectively, had a CDD education.
- The gender pattern is different for higher educational attainments, with more men holding a master's or doctorate degree than women. Approximately 459,000 women had a master's or doctorate degree in 2006. Of these, about 32,000 reside in rural or remote areas. In contrast, about 585,000 men had a master's or doctorate degree, of which about 41,000 resided in rural or remote areas.
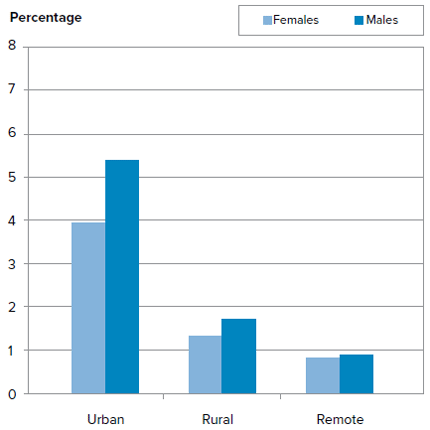
- Overall, women in rural and remote areas are the least likely to have a master's or doctorate degree compared to both their rural male counterparts and their urban female counterparts. Approximately 1.4% of rural women had achieved this educational level in 2006; the corresponding percentage is even lower in remote areas (0.9% of females). In contrast, in urban areas the corresponding percentage is approximately 4% for females and 5.4% for males (see Figure 9).
1Certificate, diploma or degree (CCD) includes: high school certificate or equivalent, apprenticeship or trades certificate or diploma, college, CEGEP or other non-university certificate or diploma, university certificate or diploma below bachelor level, university certificate, diploma or degree at bachelor's level or above.
Educational Attainment and Major Field of Study
- For women with post-secondary qualifications, there are four major fields of study: education; business, management and public administration; health, parks, recreation and fitness; and social and behavioural sciences and law. This is particularly so in rural and remote areas.
- The share of females reporting business, management and public administration as their major field of study is similar in all types of regions (approximately 27%). In contrast, there are clear regional differences for females reporting education as their major field of study. Women in remote areas are most likely to pursue this field of study, followed by women in rural areas, and finally women in urban areas, who are least likely out of the three types of regions to report education as their focus.
Figure 8 Master's Degree or Doctorate, Population 15 Years and Over, Canada, 2006
Unpaid Work
- Over 90% of women reported having spent some hours doing unpaid work and unpaid housework, regardless of where they live. Women perform approximately 5% more than their male counterparts living in the same type of region.
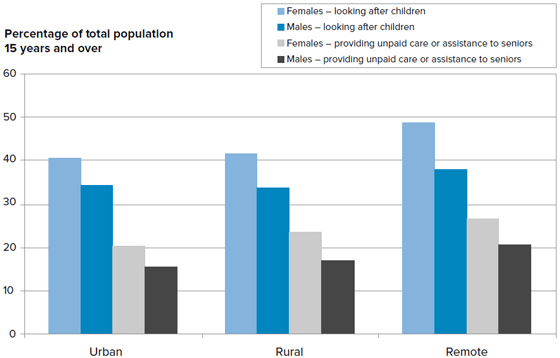
- Figure 10 shows the percentage of individuals reporting two specific types of unpaid work: looking after children, and providing unpaid care or assistance to seniors. In all types of regions, women are more likely than men to do these types of unpaid work. In rural and remote areas, however, both the percentage of women doing these types of unpaid work and the difference with their male counterparts is greater than in urban areas.
Figure 9 Unpaid Work, Canada, 2006
Crime and Violence
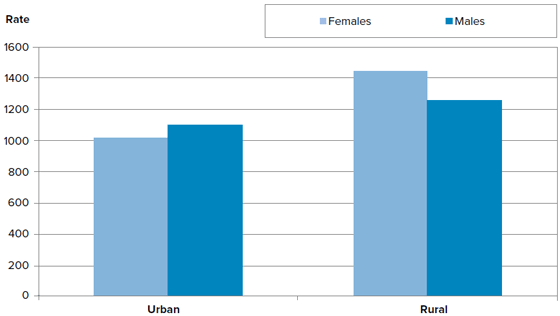
- In general, the rate of police-reported violent crime is higher in rural areas. This is particularly so for female victims. In 2008, the rate of police-reported violent crime against women living in rural areas was 1,440 per 100,000 female population (18 years of age and over), compared to a rate of 1,015 per 100,000 female population (18 years of age and over) living in urban areas. For each male victim of police-reported violent crime there are 1.15 female victims.
Figure 10 Victims of Police-Reported Violent Crime by Urban and Rural Locations, Adults Aged 18 and Over, Canada, 20081
2. Excludes data from the Halton Regional Police Service and the Durham Regional Police Service due to the incongruity between police service jurisdictional boundaries and census metropolitan area boundaries.
Note(s): Percentages may not total 100% due to rounding. Data reflect victim counts from the incident-based Uniform Crime Reporting Survey and, in total, represent 98% of the population of Canada. Coverage for each province/territory exceeds 95% except for British Columbia (92%)
Excludes incidents where the sex and/or age of the victim was unknown.
Source: Statistics Canada, Canadian Centre for Justice Statistics, Uniform Crime Reporting Survey.
Aboriginal Identity
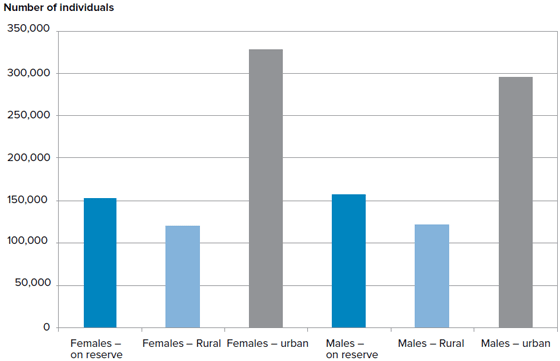
- Aboriginal women and girls comprise a large part of the rural and remote population in Canada. In 2006, approximately 600,000 women reported Aboriginal identity; about 46% reside in rural and remote areas (see Figure 11).
Figure 11 Aboriginal Identity Population, Canada, 2006
Labour Force and Aboriginal Identity
- In 2006, Aboriginal people comprised approximately 3% of the total labour force of Canada. About 49% of this population was women.
- Participation rates of Aboriginal people compared to the non-Aboriginal population were similar in each region, with differences occurring as a result of gender or region. Specifically, participation rates were lowest for Aboriginal women living on reserve (49% compared to 56% for Aboriginal males). Rural Aboriginal women reported a 60% participation rate (compared to 68% for rural Aboriginal men), while urban Aboriginal women had a 63% participation rate (compared to 73% for urban Aboriginal men).
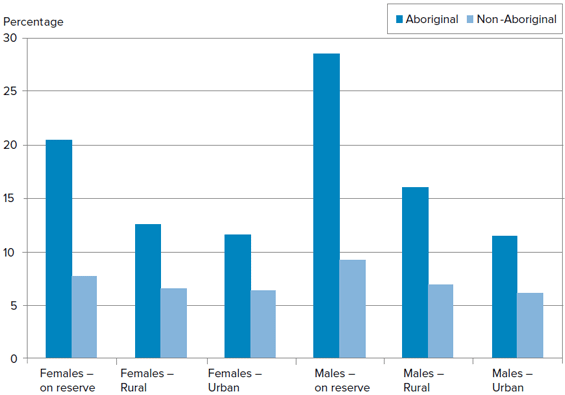
- Most of the difference between Aboriginal and non-Aboriginal identity populations is in unemployment rates. Figure 12 shows the unemployment rate for females living on reserve, in rural areas and in urban areas compared to their male counterparts, for both Aboriginal and non-Aboriginal identity populations.
Figure 12 Unemployment Rates, Canada, 2006
Employment by Occupation and Aboriginal Identity
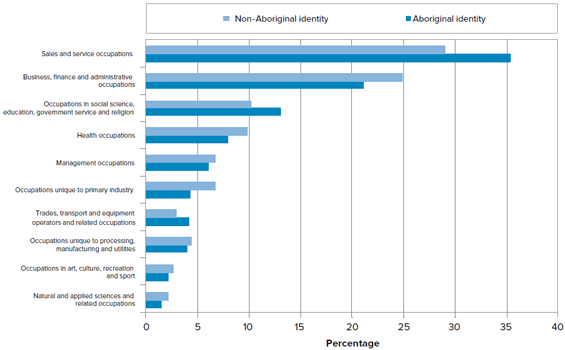
- As with non-Aboriginal women, the most common occupation for Aboriginal women is in sales and service (35%).
- For Aboriginal women on reserve, sales and service is also the most common occupation. The second largest occupational group for Aboriginal women on reserve is in social science, education, government service and religion. This represents almost 22% of the occupations for Aboriginal women and 16% of jobs for non-aboriginal women.
- Aboriginal women in rural areas, like their non- Aboriginal women counterparts, are under-represented in non-traditional occupations including natural and applied sciences and related occupations (2%); trades, transport and equipment operators and related occupations (4%); occupations unique to primary industry (4%); and occupations unique to processing, manufacturing and utilities (4%) (Figure 13).
Figure 13 Female Labour Force 15 Years and Over Residing in Census Rural Areas by Occupation, Canada, 2006
Educational Attainment and Aboriginal Identity
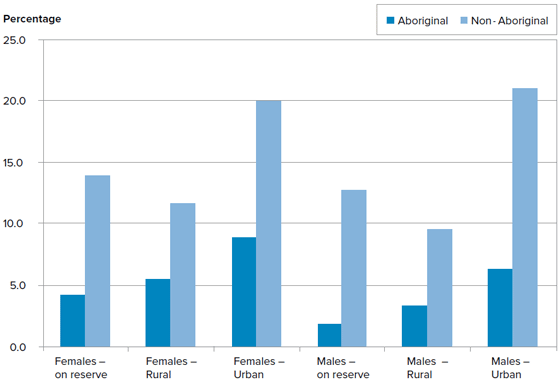
- As already observed with the statistics for the general population, and with statistics by region, women are either as likely as or more likely than men in each type of region to have a certificate, diploma or degree (CDD) education. This pattern is even more pronounced for Aboriginal peoples. In particular in rural areas, about 41% of Aboriginal women have no CDD education, compared to almost 47% of men; while in urban areas 35% of Aboriginal women fall into this category, compared to about 38% of Aboriginal men (Figure 14).
- At the opposite end of the educational spectrum, it is clear that Aboriginal women and men are less likely than their non-Aboriginal counterparts to have a university education. The lowest share of individuals with university education is on reserve and the highest share is in urban areas. In all types of regions, more Aboriginal women than Aboriginal men have a university education (Figure 14).
Figure 14 Percentage of Individuals 15 Years and Over with University Certificate, Diploma or Degree at Bachelor's Level or Above, Canada, 2006
Income Levels and Aboriginal Identity
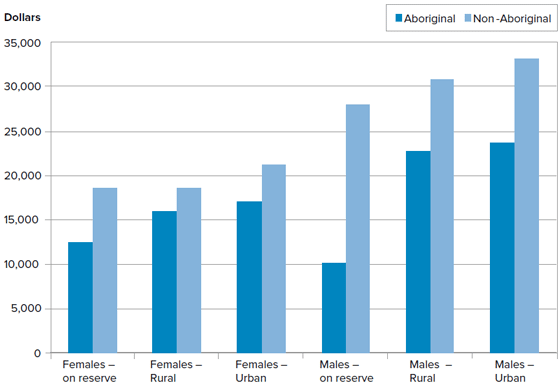
- In 2006, Aboriginal women living on reserve reported a median income (for the year 2005) of approximately $12,500; this is the lowest income level when compared to women of non-Aboriginal identity and of Aboriginal identity living in other types of regions (Figure 15). However, the median income of Aboriginal women on reserve is almost $2,500 higher than that of Aboriginal men living on reserve, with a median income at about $10,000.
- Aboriginal women living in rural and urban areas had median incomes of approximately $16,000 and $17,000 respectively, which is lower than non-Aboriginal women in the same regions (Figure 15).
- Approximately 63% of Aboriginal women and 66% of Aboriginal men living on reserve fell under the threshold of those with an income of less than $20, 000 in 2005s.
- In all types of regions (on reserve, rural and urban areas), over 53% of Aboriginal women had an income of less than $20,000 for the year 2005.
Figure 15 Median Total Income in 2005 of Population 15 Years and Over, Canada, 2006
References
du Plessis, Valerie, Roland Beshiri, Ray D. Bollman and Heather Clemenson (2002). "Definitions of Rural", Agriculture and Rural Working Paper No. 61. Catalogue. no. 21-601-MIE. (Ottawa: Statistics Canada)
Rothwell, Neil (2002). "Seasonal Variation in Rural Employment", Rural and Small Town Canada Analysis Bulletin, Vol. 3, No. 2. Catalogue no. 21-006-X. (Ottawa: Statistics Canada)
Rothwell, Neil and Ray D. Bollman (2011). "Manufacturing Firms in Rural and Small Town Canada". Rural and Small Town Canada Analysis Bulletin, Vol. 8, No. 6. Catalogue no. 21-006-X. (Ottawa: Statistics Canada)
Statistics Canada (2008). 2006 Census Dictionary. Online version available at: http://www12.statcan.gc.ca/census-recensement/2006/ref/dict/index-eng.cfm
Statistics Canada (2011). New terminology for "urban areas." The Daily, Thursday, February 3, 2011.
Appendix A: Definitions
Definition of geography
Not all datasets are tabulated using the same geographic concepts. In this report, we use two concepts of "rural" and "urban," which are described below.
In short, most of the datasets are presented by regrouping the categories of the Statistical Area Classification (SAC). This is a variant of the Standard Geographical Classification (SGC) 2011, which is the current departmental standard for geographic areas, approved May 16, 2011.1 The SAC variant covers all of Canada outside census metropolitan areas (CMAs) and census agglomerations (CAs) with the inclusion of census metropolitan influenced zones (MIZs). The classification variant meets the classification principle of exhaustiveness by ensuring that all of the census subdivisions (CSDs) in Canada are included in the classification. The CSDs that are outside of CMAs or CAs are categorized according to metropolitan influenced zones (MIZs). In contrast, most of the Aboriginal identity variables are tabulated using three alternative geographic concepts: on reserve, census urban area and census rural area.
It should be noted that the concept of "rural" based on the SAC does not overlap completely with the concept of census rural; hence, although the two concepts tend to generate similar results in terms of overall patterns and trends, the results based on the two definitions are not strictly comparable. For a detailed discussion of these geographic concepts see du Plessis et al. (2002).
1For more details see:
http://www12.statcan.gc.ca/census-recensement/2011/geo/index-eng.cfm
CMA/CA
CMA/CA is used to refer to larger urban centres; CMAs are census metropolitan areas, while CAs are census agglomerations. A CMA has an urban core with a population of at least 100,000. A CA has an urban core population of 10,000 to 99,999. Both CMAs and CAs include all neighbouring municipalities where 50% or more of the workforce commutes to the urban core.
Towns or municipalities outside CMAs and CAs are disaggregated into four "census metropolitan area and census agglomeration influenced zones" (MIZ) based on the size of commuting flows of the labour force to any CMA or CA. The strength of commuting flows between rural areas and urban centres serves as a proxy for the degree of economic and social linkages between a rural area and a larger urban centre. For further information on MIZ, see McNiven et al. (2000).
Rural
In this report, the term rural is used to refer to an aggregate comprising three types of MIZ areas, Strong, Moderate and Weak MIZ. The Strong MIZ category comprises areas where 30% or more of the labour force commutes to a larger urban centre. The Moderate MIZ category comprises areas where between 5% and 29% of the labour force commutes to a larger urban centre. The Weak MIZ category comprises areas with a commuting flow of more than 0% and less than 5%.
Remote
in this report, the term remote is used to refer to the aggregate comprising No MIZ areas and the areas of the Territories that are not part of a Census Agglomeration (CA). The No MIZ category comprises those areas where no individuals commute to a CMA/CA.
On reserve – Aboriginal identity variables
This includes eight census subdivision (CSD) types legally affiliated with First Nations or Indian bands, i.e., Indian reserve (IRI), Indian settlement (S-E), Indian government district (IGD), terres réservées aux Cris (TC), terres réservées aux Naskapis (TK), Nisga'a village (NVL), Nisga'a land (NL) and Teslin land (TL), as well as 35 additional CSDs of various other types that are generally northern communities in Saskatchewan, the Northwest Territories and Yukon, which have large concentrations of Registered Indians.
Census urban (urban areas) – Aboriginal identity variables
Census urban is the term used to describe areas with a minimum population concentration of 1,000 persons and a population density of at least 400 persons per square kilometre, based on the current census population count. All territory outside urban areas is classified as census rural. On-reserve CSDs are excluded from this category.
Census rural (rural areas) – Aboriginal identity variables
Census rural areas include remote and wilderness areas and agricultural lands, as well as small towns, villages and other populated places with a population of less than 1,000. On-reserve CSDs are excluded from this category.
Important note
This report used data from the Census of population 2006, which used the concept of "urban areas." in this report we referred to "urban area" as "census urban" to emphasize its application in the census context. On February 3, 2011, Statistics Canada introduced a new terminology that it will use with respect to geographic areas that have in the past been referred to as "urban areas." The term "population centre" replaced the term and concept of "urban area." Details on the new concept are reported at: www.statcan.gc.ca/daily-quotidien/110203/dq110203b-eng.htm
Aboriginal identity
This refers to those persons who reported identifying with at least one Aboriginal group, that is, North American Indian, Métis or Inuit, and/or those who reported being a Treaty Indian or a Registered Indian, as defined by the Indian Act of Canada, and/or those who reported they were members of an Indian band or First Nation. In 1991 and previous censuses, the Aboriginal population was defined using the ethnic origin question (ancestry). The 1996 Census included a question on the individual's perception of his/her Aboriginal identity. The question used in the 2006 and 2001 censuses is the same as the one used in 1996.
Note that Aboriginal ancestry refers to those persons who reported at least one Aboriginal ancestry (North American Indian, Métis or Inuit) to the ethnic origin question. ‘Ethnic origin' refers to the ethnic or cultural origins of the respondent's ancestors. ‘Aboriginal ancestry' was referred to as ‘Aboriginal origin' prior to the 2006 Census. The content of the 2006 variable remains unchanged compared with previous censuses.
- Date modified: