Archived information
This content is archived because Status of Women Canada no longer exists. Please visit the Women and Gender Equality Canada.
Archived information is provided for reference, research or recordkeeping purposes. It is not subject to the Government of Canada Web Standards and has not been altered or updated since it was archived. Please contact us to request a format other than those available.
Infographic: Women and Paid Work
Infographic: Women and Paid Work
These highlights are from the "Women and Paid Work" chapter of the 7th edition of Women in Canada: A Gender-based Statistical Report.
-
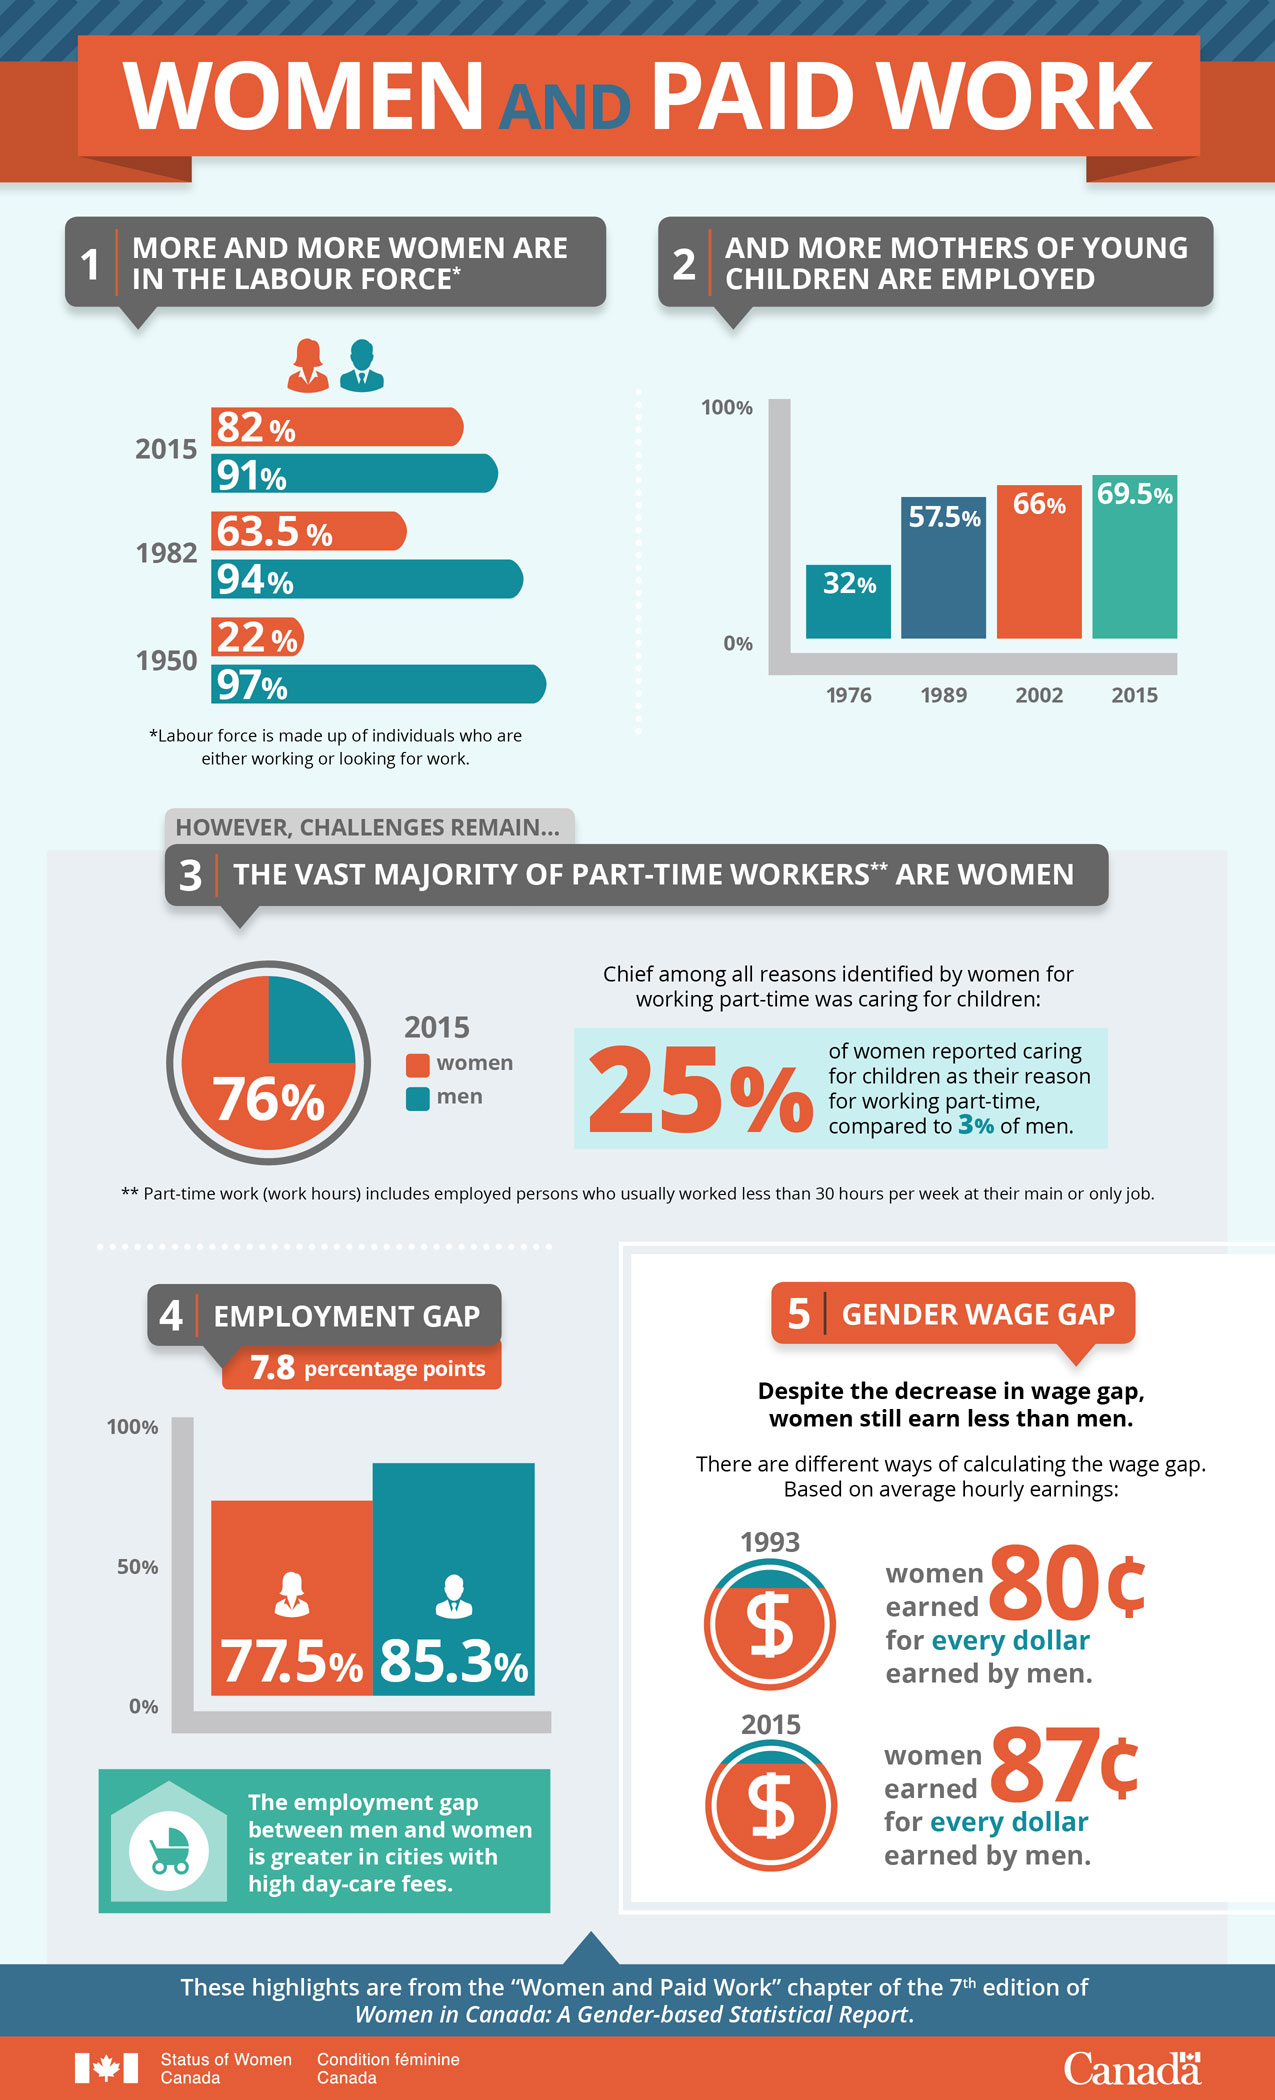
More and more women are in the labour force*
Women’s labour force participation trended upward between 1950 and 2015.
Graphic 1: 82% of women in Canada aged 25 to 54 participated in the labour market in 2015, compared to 62.5% in 1982 and 22% in 1950. Women’s participation rate is still lower than men’s, although a smaller proportion of men participated in the labour market in 2015 (91%) than in 1982 (94%) and 1950 (97%).
*Labour force is made up of individuals who are either working or looking for work.
-
And more mothers of young children are employed
Graphic 2: Between 1976 and 2015, the employment rate of women whose youngest child was under the age of 6 grew:
Year Less than 6 years 2015 69.5% 2002 66% 1989 57.5% 1976 32% However, despite the progress made, there are challenges that remain…
-
The vast majority of part-time workers** are women
While the vast majority of both women and men were employed on a full-time basis, women were over-represented among those working part-time.
Graphic 3: In 2015, about 76% of all part-time workers were women.
Chief among all reasons identified by women for working part-time was caring for children: 25% of women reported caring for children as their reason for working part-time, compared to 3 % of men.
** Part-time work (work hours) includes employed persons who usually worked less than 30 hours per week at their main or only job.
-
Employment gap
Graphic 4: In 2015, 77.5% of women in the core working ages were employed compared to 85.3% of their male counterparts—a difference of 7.8 percentage points in favour of men.
The employment gap between men and women is greater in cities with high day-care fees.
-
Gender wage gap
Despite the decrease in wage gap, women still earn less than men.
There are different ways of calculating the wage gap. Based on average hourly earnings, women earned $0.87 for every dollar earned by men in 2015; while in 1993 women earned $0.80 for every dollar earned by men.
- Date modified: